Рус
Рус


API Import to Russia (Q1 2022)
From January to March 2022, Russia imported 5,200 tons of APIs worth 53 billion RUB (customs clearance and VAT included), up 23.1% in physical terms from Q1 2021. However, the growth rate in monetary terms (rubles) is –7.5%, the first negative growth rate in 10 years.
In January 2022, the growth rate was –40% in monetary and 68% in physical terms (kilograms). In February, Russia saw positive growth rates in both monetary and physical terms—60% and 41%, respectively. In March, however, both growth rates were negative, –20% in monetary and –22% in physical terms.
Russia imported APIs from 26 countries (EEU countries excluded) in March 2022, while in February 2022 and March 2021 the number was 30. Chinese importers accounted for the largest volumes in both monetary and physical terms, with their imports in monetary terms up 48% from March 2021 and imports in physical terms down 3%. In fact, China was able to quickly adapt to the logistical difficulties that arose due to a number of European container lines refusing to work with imports intended for Russia. The situation is fundamentally different with India, though—last month the country, which used to consistently place 2nd in the total volume of imports, was 5th in monetary and 4th in physical terms, with its imports down 62% in monetary and down 84% in physical terms.
China is followed by Slovenia—the latter’s imports rose by 20% in monetary terms. Working with KRKA, Slovenia increased its imports of losartan (volumes increased 3.3 times from 2021) and amlodipine (volumes doubled), which contributed to the growth rates the most. The Netherlands placed 2nd in physical terms—its imports grew 11.4 times against March 2021. Three Russian companies worked with the Netherlands, with Veropharm accounting for the largest volume. The import of lactulose contributed to the country’s growth rates the most.
Apart from India, USA and Spain saw the worst growth rates, –70% and –65%, respectively. USA stopped cooperating with one out of its two Russian partners, importing only bile (–49% in physical terms). As for Spain, the number of its partners went down from 17 to 7, and the number of imported APIs from 21 to 6. In particular, the import of amoxycillin fell by 61%.
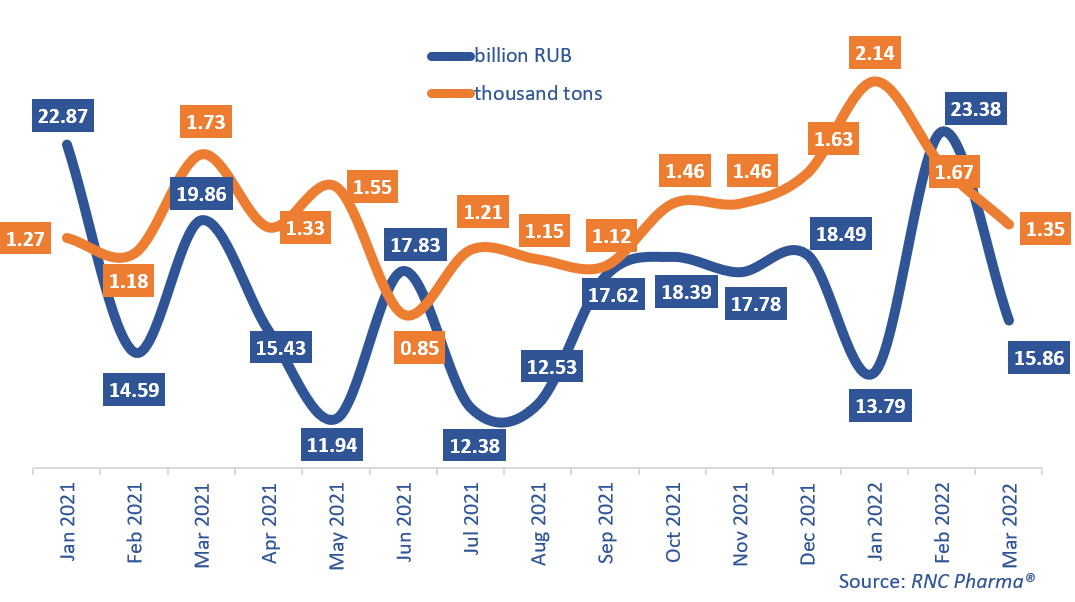
Growth rates of pharmacopoeial and commercial API imports to Russia (EEU countries excluded), free circulation prices including customs clearance and VAT (January 2021–March 2022)