Рус
Рус


Database Update: Pharmaceutical Drug Production in Russia (March and Q1 2020)
Between January and March 2020, Russia manufactured 102.6 bln RUB worth of pharmaceutical drugs (manufacturers’ prices, VAT included), which is in monetary terms (rubles) 18 higher than that of the same period in 2019. While the dynamics in monetary terms are promising and not much different from those in late 2019, the dynamics in physical terms (units) are only +0.2%, with 1 bln units manufactured. If calculated in minimum dosage units (MDU), the manufactures volume amounts to 18.6 bln MDUs, with the dynamics of +8.2%.
Due to the coronavirus pandemic and a number of other factors, both macroeconomic and regulatory, the monthly dynamics are somewhat different from those in 2019. In particular, the manufactured volume has risen by +27% since February 2020 and by +14% since March 2019. The long-term dynamics in monetary terms are very mild, while the monthly dynamics are even negative. In March, we saw several waves of rush demand for pharmaceuticals, mostly low-cost drugs, due to the growing incidence of COVID-19 in Russia, and the manufacturers had to increase production.
Despite the pandemic, the dynamics of the Rx and OTC manufacture in physical terms are still fundamentally different, +7.8% and -5%.
Mosfarm has the highest dynamics among the top 15 manufacturers of Rx drugs (production increased by 17 times). Sodium Chloride and Glucose contributed to the dynamics. Mosfarm is followed by Vertex, with the dynamics of +64%. The production of Gluten BF (manufacture grown by 5 times), Levofloxacin (4.4 times), and Azithromycin (2.4 times) contributed to the dynamics. Solopharm has the lowest dynamics (-26%) due to decreased manufacture of Sodium Chloride and Glucose.
As for OTC drugs, Slavapteca has the highest dynamics. The company’s manufacture has grown by 4 times in physical terms due to the increased production of Activated Carbon (by 2.1 times) and Citramon (+94%). Pharmstandard has the lowest dynamics in the top, with -38%. While the manufacture of Arbidol has grown by 2.4 times, the production of the company’s other drugs have decreased.
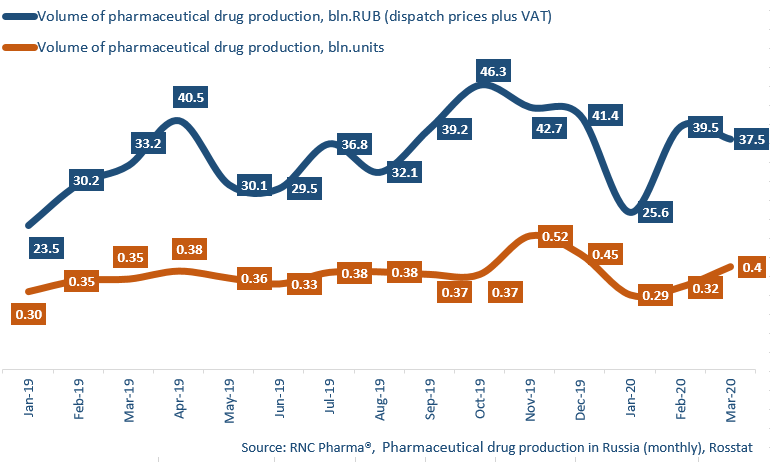
Dynamics of pharmaceutical drug production in Russia, including production of pharmaceuticals of foreign companies on owned or contract plants, in physical (units) and monetary terms (RUB, VAT included) (January 2019 – March 2020)