Рус
Рус


Database Update: API Import to Russia (March 2018)
Between January and March 2018, Russia imported 22 bln RUB worth of APIs (free circulation prices, VAT included), which is in monetary terms 28% higher than that of the same period of 2017. In physical terms, Russia imported 2680 tons of APIs, which is 11% higher than that of the same period of 2017.Q1 2018 2018, the import of technical APIs shows an 8% and 4.4% fall in physical and monetary terms, respectively. 97% was imported from China, 2.7% from India, and the rest from the Czech Republic.
Between January and March 2018, Russia imported 46 API INNs, while it used to be 64 in 2017. Atazanavir is the most imported one this year, with 946 kg (60.5 mln RUB) as of Q1 2018. Around 90% of the imported Atazanavir was ordered by Pharmasyntez (Irkutsk) – in 2017 it registered Simanod, while the remaining 10% was bought by Farmoslavl (R-Pharm Group).
The most imported technical APIs are Fluconazole, imported by Aktivny Komponent, and Chondroitini sulfas, imported by Sintez (Kurgan). These APIs were also imported as pharmacopoeial APIs, although not as much.
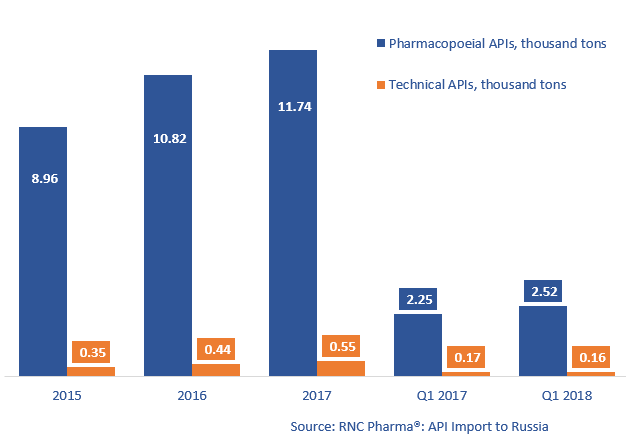
Dynamics of pharmacopoeial and technical API import to Russia (2015 – 2017, Q1 2018), thousand tons