Рус
Рус


API Import to Russia (October 2022)
In January–October 2022, Russia imported 160.8 billion rubles’ worth of APIs (customs clearance and VAT included), down 1.7% from the same period in 2021. In physical terms, the import was up 21.9%, with more than 16,500 tons imported.
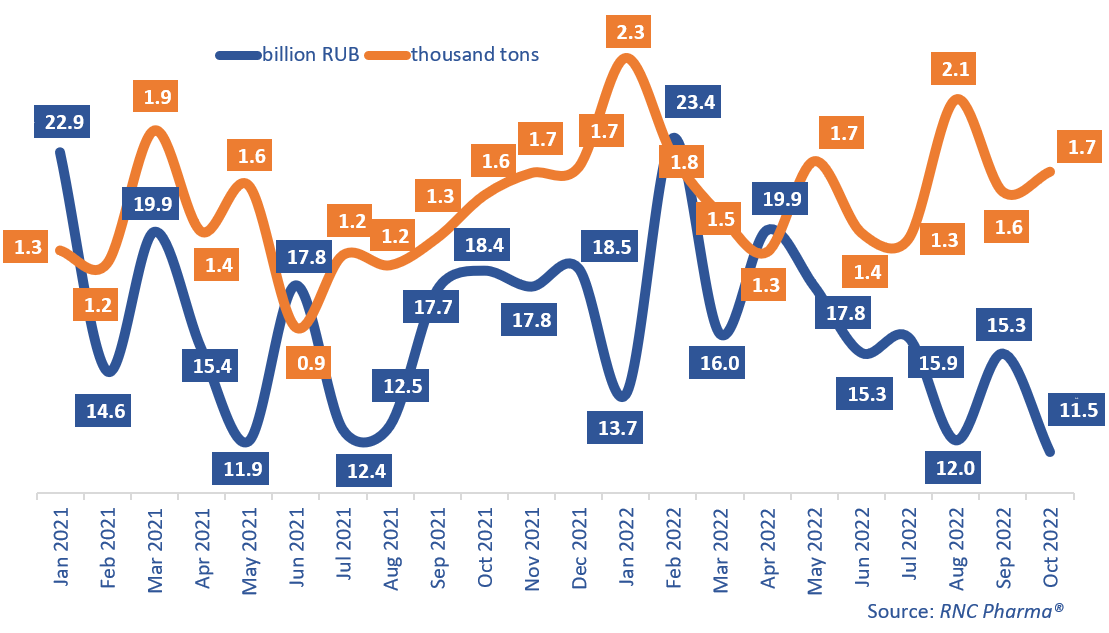
October 2022 pretty much made the results of the first ten months of 2022—the import went down 37% from October 2021. While the growth rate was not the worst this year—the import declined 40% back in January—in absolute values, the import was 11.5 billion rubles, a 25-month low. In physical terms, the growth rate was 8%, stable but lower than the average of the year. However, the import in absolute values was far from the lowest, 1,700 tons. The growth rates in monetary and physical terms differed that much because of the deflation rate—the Laspeyres price index was –16.2% against October 2021.
The total number of INNs kept increasing—679 INNs, up 42 from January–October 2021. The number of manufacturers also went up, from 670 in January–October 2021 to 736 in January–October 2022.
KRKA, Servier, and Lonza imported the largest volumes, which makes sense because all three are localized in Russia. In particular, Lonza imported osimertinib for AstraZeneca. However, they all had mediocre growth rates, except for maybe Lonza—its imports went up 73%. Shandong Anxin Pharmaceutical had the best growth rates—it imported only amikacin for Syntez, and the company’s imports increased more than 14,000 times against the comparison period. Wuxi Fortune Pharmaceutical comes second—the import of its ademetionine went up 312 times against January–October 2021; Velparm purchased the largest volumes.
As for physical terms, Chinese manufacturers had the best results here too. Notably, Fuxin Long Rui Pharmaceutical—its imports of molnupiravir and sofosbuvir for the Pharmasyntez group grew 808 times against January–October 2021. The imports of pyrantel and atropine by Minsheng Group went up 700 times. Ozon purchased the whole volume of pyrantel, while atropine was imported for Long Sheng Pharma Rus and the Moscow Endocrine Plant.
Growth rates of pharmacopoeial and commercial API imports to Russia (EEU countries excluded), free circulation prices including customs clearance and VAT (January 2021–October 2022)