Рус
Рус


Pharmaceutical Drug Production in Russia (July 2021)
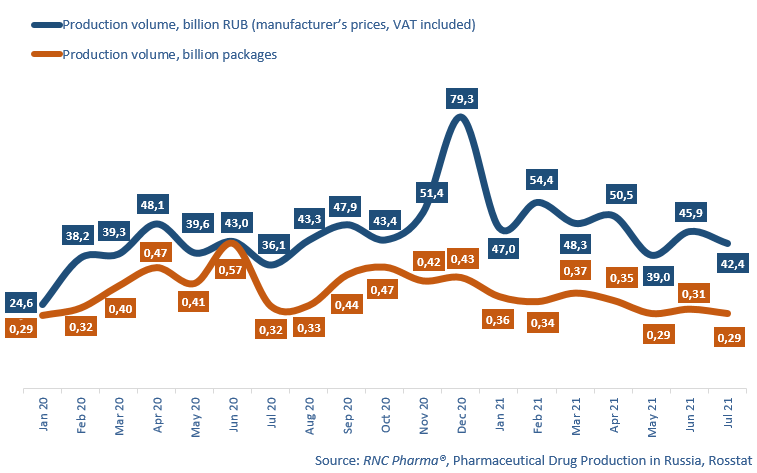
Between January and July 2021, Russia manufacturers produced 327.4 billion rubles worth of pharmaceutical drugs (manufacturer’s prices, VAT included), up 21.7% from 2020 in monetary terms (rubles). The growth rates in physical terms (packages), however, were negative, which was rather predictable because of the rush demand during the first and second waves of COVID-19. The production volume in physical terms amounted to 2.32 billion packages, with the growth rate of -16.5%. If calculated in minimum dosage units (MDU), the growth rate is -7.9%, with the production volume of 45 billion MDUs.
The production volume in physical terms declined the most between April to June 2021. The absolute minimum growth rate of the past 10 years was observed during this period as well: -45% in June. The situation started to go back to normal in July; the growth rates were -9% in packages and about -6% in MDUs.
Despite the fact that the drop in production volumes in physical terms in 2021 is primarily due to last year’s consumption imbalances, the growth rates still had significant differences in terms of the type of drug. The growth rate of the production of Rx drugs in physical terms amounted to -9%, while the production of OTC drugs plummeted by 23%. However, note that the average retail package of an OTC drug has significantly grown in size over the past year, so the growth rates are not as bad compared to the Rx group if calculated in MDUs.
Binnopharm Group has the largest production volume among the top 20 manufacturers of Rx drugs. While the company’s growth rate is -7%, it is still a rather good result because of the general drop in production. A branch of the Gamaleya Research Institute of Epidemiology and Microbiology Medgamal has the highest growth rates; its production increased 193 times over the year. This result was obviously achieved not so much by the company’s own production site as by its industrial partners producing the Gam-COVID-Vac vaccine.
Outside the vaccine sector, Sun Pharma (+30%) and Renewal (+26%) can also boast impressive growth rates. Cephalosporins Cefozalin and Cefotaxime contributed to the growth rates of Sun Pharma (production increased 3.1 and 1.6 times over the year, respectively). As for Renewal, it was Anaprilin (7 times) and Piracetam (2.7 times).
Between January and July 2021, Pharmstandard was the top company among the top 20 manufacturers of OTC drugs demonstrating one of the best growth rates of +32%. Considering how vast the company’s portfolio is, it is rather difficult to pick the products that contributed to the growth rates, but we will note the following brands: Acetylsalicylic Acid (increased 2.5 times) and of course Arbidol (+80%). Valenta had the best growth rates among all OTC drug manufacturers, doubling its production. Grammidin (increased 5 times) and Trimedat (3.1 times) contributed to the company’s growth rates.
Volumes of pharmaceutical drug production in Russia, including production of pharmaceuticals of foreign companies on owned or contract plants, in physical (packages) and monetary terms (RUB, VAT included) (January 2020 – July 2021)