Рус
Рус


Pharmaceutical Drug Production in Russia (March and Q1 2022)
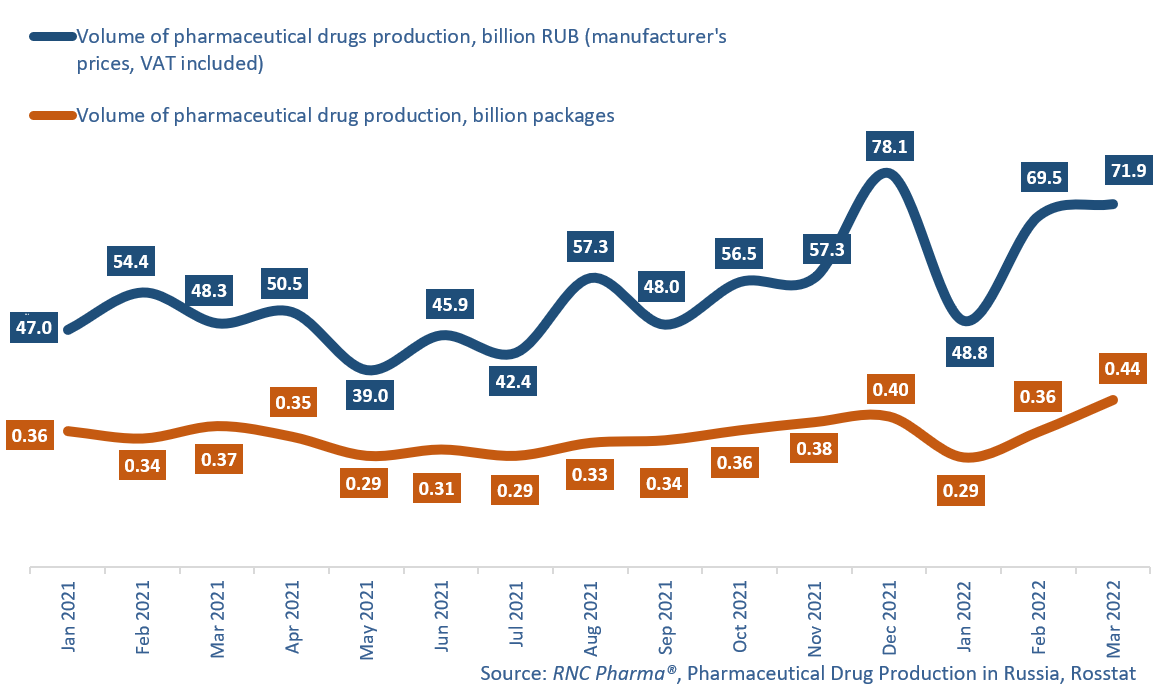
In January–March 2022, Russian manufacturers produced 190.2 billion rubles’ worth of pharmaceutical drugs (manufacturer’s prices, VAT included), up 27% from January–March 2021. In physical terms, the production volume was 1.09 billion packages, up 1.6% from the same period in 2021. If calculated in minimum dosage units (MDU), the growth rate was 2.5%, with 20 billion MDUs produced.
The results of March 2022 helped the growth rates in Q1 the most, with the production up 49% in monetary and up 18.6% in physical terms. The growth rates in February 2022 were positive as well (3.5% in rubles and 23.7% in packages).
While increased drug production in March is nothing out of the ordinary during this season, this year Russian manufacturers saw a rush provoked by the events in Ukraine. They had to work at an accelerated pace, which proved to be doubly difficult due to a serious lack of pharmaceutical raw materials, with the logistics system completely reorganized. In addition, the foreign exchange market situation was very tense in the early stages of the crisis, which could not but affect the cost of production.
This rush demand was short-lived, however. The situation was most difficult in the first weeks of March 2022, but the standard consumption trends typical for the season more or less returned by mid-April—obviously adjusted for the fact that consumers had stocked up on products. But the manufacturers had to quickly adjust too—they had to change their plans for the range of products produced. They decided to focus on producing OTC drugs—the manufacture of OTC products grew by 32.7% in packages, while that of Rx drugs increased by only 4.6%.
Tulapharm (manufactures grew 7.4 times against March 2021), Vifiteh (5.2 times) and Valenta (5 times) had the best growth rates in physical terms among the top 20 companies in March 2022. Tulapharm produced 79 brand names in March 2022 against 16 in March 2021, with simple products—Iodine, Chlorhexidine and Menovasin—contributing to the company’s growth rates the most. Vifiteh’s product range almost tripled compared to March 2021—last month, the company manufactured 34 brand names, with Mucaltin and Chlorophyllipt helping the growth rates the most. As for Valenta, it produced 5 brand names in March 2022 against 3 one year earlier, and its Ingavirin and Grammidin contributed to the growth rates.
As for prescription drugs, there is only one example of high growth rates in the top 20—Alsi Pharma doubled its manufacture. The company’s product range did not saw any drastic changes, and its Atorvastatin and Indapamide contributed to the growth rates the most (the imports grew 5.8 and 2.5 times against March 2021, respectively). The growth rates of Pharmstandard (+78%) and Servier (+49%) are also worth mentioning. The manufacture of Taufone (grew 14 times) and Combilipen (+82%) helped the growth rates of Pharmstandard, while the French manufacturer was able to increase its growth rates thanks to the production of Detralex (+87%) and Diabeton (+81%). As for the companies outside the top 20, the production of Feron went up 3.3 times, with its Viferon contributing to the growth rates.
Volumes of pharmaceutical drug production in Russia, including production of pharmaceuticals of foreign companies on owned or contract plants, in physical (packages) and monetary terms (RUB, VAT included) (January 2021–March 2022)