Рус
Рус


Pharmaceutical Drug Production in Russia (April 2020)
Between January and April 2020, Russia manufactured 150 bln RUB worth of pharmaceutical drugs (manufacturers’ dispatch prices, VAT included), which is in monetary terms (rubles) 17.7% higher than in 2019. The dynamics in physical terms (units) are +6.6%, thanks to the high activity in March and April. The total production volume for the period amounted to 1.47 bln units. If calculated in minimum dosage units (MDU), the production volume is 26.4 bln units, and the dynamics are +11.7%.
February accounted for the highest dynamics in monetary terms, with +31%, against +16.8% in April. However, the production volume in April was record-worthy 46.3 bln RUB (manufacturers’ dispatch prices, VAT included). The dynamics in physical terms in April’s were high as well (+23.1% in units, and +20.7% in MDU).
The dynamics of the OTC and Rx production remained uneven, but due to the rush demand for certain categories of OTC drugs, the dynamics in April improved considerably. The dynamics of the OTC production in physical terms in April are +14.5%, and 35% for the Rx production. However, the dynamics of the OTC production for the first four months of 2020 are only +0.5%.
Mosfarm still has the highest dynamics in physical terms among the top 15 manufacturers of Rx drugs. The company’s manufacture has grown by 18.4 times, inflation solutions Sodium Chloride and Glucose contributed to the dynamics. Gippokrat also had high dynamics (manufacture grown by 4.5 times), thanks to Ethyl Alcohol and Limanovit-E. Only four companies in the top 15 had negative dynamics for the period between January and April 2020, with the worst results belonging to Pharmstandard (-22%) and Biotec (-15%).
Slavyanskaya Apteka has the highest dynamics in physical terms among the top 15 manufacturers of OTC drugs. Thanks to Naphthyzin, the company’s manufacture has doubled. Slavyanskaya Apteka is followed by Research Institute of Medicine and Standardization, its Aseptolin contributed to the dynamics. Antiseptics, especially OTC alcohol-containing ones, surged in demand during the hype. Pharmstandard has the lowest dynamics, -24%. While the company increased the manufacture of Arbidol by 4.7 times due to the high demand, the occasional hype could not reverse the falling demand in the OTC category.
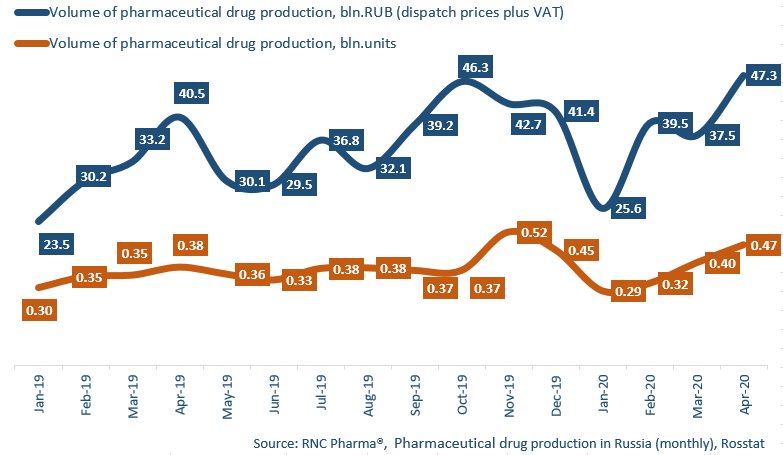
Dynamics of pharmaceutical drug production in Russia, including production of pharmaceuticals of foreign companies on owned or contract plants, in physical (units) and monetary terms (RUB, VAT included) (January 2019 – April 2020)