Рус
Рус


Database Update: Pharmaceutical Drug Production in Russia (August 2019)
Between January and August 2019, Russia produced 255.8 bln RUB worth of pharmaceutical drugs (manufacturers’ prices, VAT included), which is in monetary terms (rubles) 20.2% higher than that of the same period in 2018. In physical terms, the dynamics are +4.5%, with the production volume of 2.83 bln units. If calculated in minimum dosage units (MDU), the dynamics are +3.5%, with the production volume of 47 bln MDUs.
The dynamics of the production in August 2019 are +22% in monetary terms and +11.6% in physical terms. The dynamics of the Rx drug production for the period between January and August 2019 are +13.8% in units and +12.5% in MDUs, while those of the OTC drug production are -1.4% in units and -5% in MDUs.
195 out of the 285 manufacturers of Rx drugs have positive dynamics for the period. Among the top 20 manufacturers with the highest production volume, only Stada has negative dynamics, with -13.6% in physical terms. The production of Enalapril, Mexiprim, Cardionate and others has dropped. The leader in the top 20 is Gedeon Richter, with the dynamics of +63% in physical terms. The production of the company’s Verospiron has risen by 4.6 times. While the production of most dosage forms is localized in full cycle, 25 mg tablets are imported in-bulk. Gedeon Richter is followed by Ozon, with +44% in physical terms. The production of its Meloxicam has risen by 20.8 times.
Among the 151 OTC drug manufacturers, 64 companies have negative dynamics. Moreover, 10 companies out of the top 20 has negative dynamics. Uralbiofarm has the lowest dynamics in the top 20, with -37% in physical terms. Acetylsalicylic Acid, Citramon, Activated Carbon, Allochol and Dibazol have the highest drop in production. Samaramedprom has the highest dynamics in the top 20, with the production of Pertussinum having risen by 7.6 times.
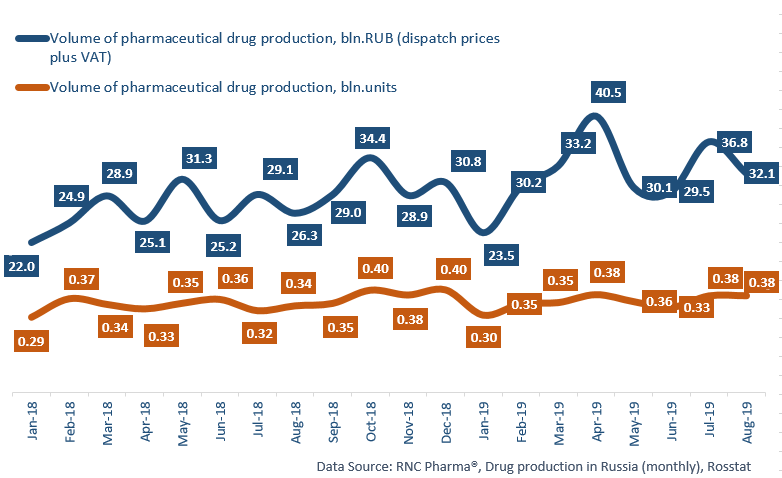
Dynamics of pharmaceutical drug production in Russia, including production of pharmaceuticals of foreign companies on owned or contract plants, in physical (units) and monetary terms (RUB, VAT included) (January 2018 – August 2019)