Рус
Рус


Database Update: Pharmaceutical Drug Production in Russia (December 2018)
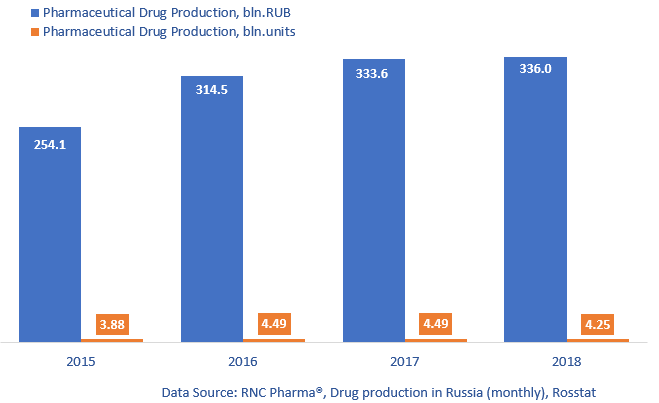
Unfortunately, 2018 was not a profitable year for Russian pharmaceutical production. In 2018, Russia produced 336 bln RUB worth of pharmaceutical drugs (dispatch prices, VAT included), which is in monetary terms only 0.7% higher than that of 2017. These dynamics is the lowest since 2015. In physical terms, the dynamics are -5.3% (4.3 bln units of pharmaceuticals.)
If calculated in minimum dosage units (MDU), the dynamics in physical terms are +0.7%. The total production volume is 70.8 bln MDUs. The dynamics of Rx drug production are +8.6%, and 30-piece units are being produced more and more. As for OTC drug production, the dynamics are -5.8%.
In December 2018, Russia produced 3.4 bln MDUs of both Rx and OTC drugs. Among the top Rx drug producers in physical terms, Vertex has the highest dynamics (+27%.) In 2018, it started to produce 11 new trademarks. Its Bisoprolol has the biggest production volume, while Rosuvastatin has the highest dynamics (a 3.5 times increase.) KRKA has also increased its production (+21%), especially the production of Valsacor (a 17 times increase.)
Among the top OTC drug producers, Avexima and Slavyanskaya Apteka have the highest dynamics in physical terms. The dynamics of Avexima are 61%, its Furacilin accounts for 34% of the production. The dynamics of Slavyanskaya Apteka are +43%, its Naftizin accounts for 90% of the production.
Read more about pharmaceutical drug production in Russia (November 2018) here: http://www.rncph.com/news/26_12_2018
Dynamics of pharmaceutical drug production in Russia, including production of pharmaceuticals of foreign companies on owned or contract plants, in physical (units) and monetary terms (RUB, VAT included) (January 2017 – December 2018)