Рус
Рус


Database Update: Pharmaceutical Drug Export from Russia (September 2019)
Between January and September 2019, Russia exported 32.5 bln RUB worth of pharmaceutical drugs (customs duties included), which is in monetary terms (rubles) 22.4% higher than that of the same in 2018. The two-digit growth rates have been registered since 2018 (the dynamics in 2018 were +16.1%). The dynamics in physical terms (units) are +6.7%, with 653 mln units.
The exports from Russia to the EEU countries amount to 12.6 bln RUB (customs duties included), which is around 38.6% of the total export. While the dynamics here are high as well (+20.7%), the dynamics of the export from Russia to the countries outside the EEU are a little higher (+23.5%).
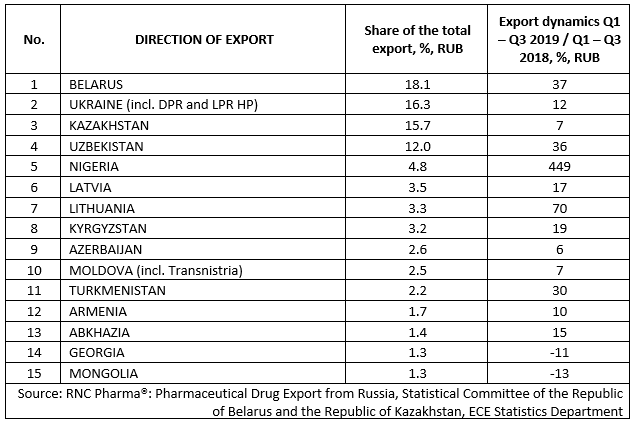
However, Belarus is still the first among the main directions of export, with 5.9 bln RUB (around 18% of the total export from Russia). The dynamics in monetary terms are +37%. Belarus is followed by Ukraine, with 16.3% of the total export and the dynamics of +12%. The Donetsk People’s Republic and the Luhansk People’s Republic account for 94% of the exports to Ukraine. The import line consists of Russian-made pharmaceuticals (around 42%) and gray exports of foreign pharmaceuticals, which the actual license holders might not even be aware of.
The exports to Nigeria have the highest dynamics (exports increased by 5.5 times). The Chumakov Federal Scientific Center for Research and Development of Immune and Biological Products of Russian Academy of Sciences was the only exporter to Nigeria; and Yellow Fever Vaccine was the only pharmaceutical drug exported. The dynamics are that high because the vaccine was mostly exported in July and September this year against October last year.
Among the 8 new directions of export this year, Iran accounted for the highest export volumes. Biocad was the only exporter to Iran, exporting Bevacizumab, Herticad and Trastuzumab. While the company’s export volume to Iran amounted to 178.3 mln RUB, Iran failed to enter the top 20 directions of export.
Indonesia and Mauritania were also among the newcomers, importing Semax from Peptogen and Yellow Fever Vaccine from the Chumakov Federal Scientific Center for Research and Development of Immune and Biological Products of Russian Academy of Sciences, respectively.
Top 15 directions of the export of pharmaceutical drugs from Russia (including to the EEU countries), January – September 2019, in monetary terms