Рус
Рус


Pharmaceutical Drug Import to Russia (September and Q1 – Q3 2020)
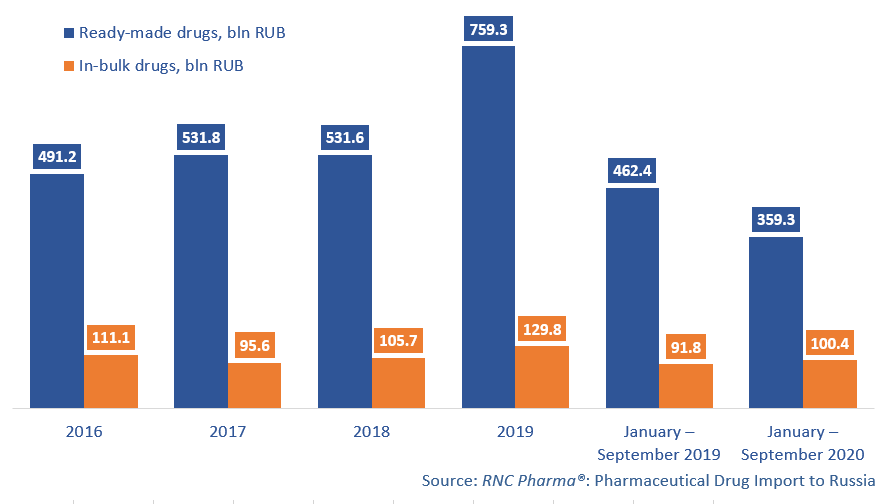
Between January and September 2020, Russia imported RUB 359.3 bln worth of ready-made pharmaceutical drugs (customs clearance and VAT included), which is in monetary terms (rubles) 22% lower than in 2019. The dynamics of the in-bulk import are +9%.
However, the dynamics in physical terms are negative for both groups. The import volume of ready-made drugs is 876.4 mln units, with the dynamics of -37%, or 17.5 bln minimum dosage units (MDU) (-33%). As for in-bulk drugs, the dynamics are -37% in MDUs, with the import volume of 1.65 bln MDUs.
The import of ready-made drugs in September followed the main trends of Q1 – Q3 2020. The dynamics have been negative since July; back in June, manufacturers were stocking up their warehouses to get ready for the launch of the labeling system. By September, the dynamics have improved (-30%), compared to July and August (-64% and -58%, respectively). The dynamics of the in-bulk import are -31% due to the high activity of the importers between May and July 2020.
Only 93 companies out of the 280 manufacturers that were importing ready-made drugs to Russia between January and September 2020 have positive dynamics in monetary terms. Biogen Idec has the highest dynamics among the top 20 companies (imports grown by 3.2 times, mainly thanks to Spinraza, drug for spinal muscle atrophy). TAD Pharma (Germany) has increased its imports by 985 times, which, however, allowed it to enter only the top 150. Among the three imported drugs, Clopidogrel contributed to the dynamics the most.
As for in-bulk, as many as three companies in the top 20 have several-fold dynamics, and Astellas and Aspen have the highest dynamics (imports grown by 3.2 and 3.1 times, respectively). Flemoxin Solutab once again contributed to the dynamics of Astellas, and Fraxiparine, which is packaged at the facilities of Nanolek in the Kirov region, was Aspen’s most imported product out of three. Gilead Sciences, which has increased it imports by 2.2 times, is also worth mentioning. Their antiviral drug Epclusa, packaged by Pharmstandard in Kursk, contributed to the dynamics the most.
Dynamics of import of pharmaceuticals to Russia (EEU countries excluded), free circulation prices including customs clearance and VAT, RUB (2016 – 2019, January 2019 – September 2020)