Рус
Рус


Database Update: API Import to Russia (July 2019)
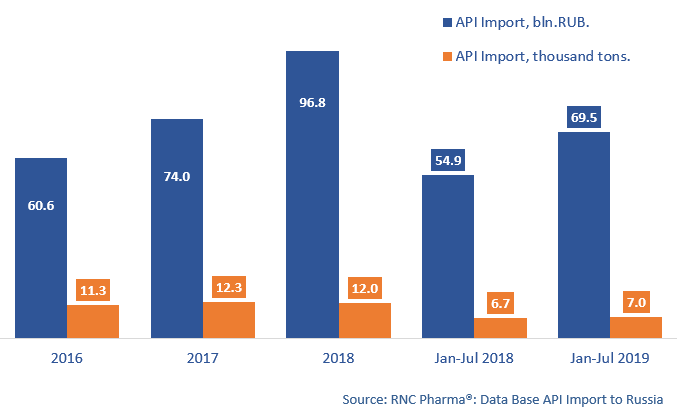
Between January and July 2019, Russia imported 69.5 bln RUB worth of APIs (free circulation prices, VAT included), which is in monetary terms (rubles) 26.5% higher than that of the same period in 2018. As earlier, a significant price increase contributed to the high dynamics. In physical terms (tons), the dynamics are +4.5%, with the import volume of 7 thousand tons.
The leader in both monetary and physical terms is still China, with around 18.7% of the total import volume in monetary terms and nearly 52% of the import in physical terms. The dynamics in monetary terms are +33%, which is higher than the average dynamics, but not record-worthy, since the import from the Netherlands has increased by 2.2 times, for example. The dynamics in physical terms are -12.8%, with the import of Acidum Acetylsalicylicum and Paracetamolum having fallen by nearly 2 times in physical terms, which is unusual for these substances. However, the price of Acidum Acetylsalicylicum has risen by 2.1 times, while that of Paracetamolum by 1.6.
China is followed by India. The API import from India in physical terms has risen significantly; the dynamics in monetary terms are +31% and those in physical terms are over +20%. Mass substitution is not occurring here; if the products intersect, the dynamics in identical positions most often have a unidirectional character.
The product line of pharmacopoeial APIs has grown by 19 positions, making it 504 INNs. Dydrogesteronum, imported by Veropharm, is the absolute leader in dynamics, with a 100 times increase. Abbott localized the production of Duphaston at the facilities of Veropharm.
The product line of commercial APIs has grown from 86 to 96 INNs. Narlaprevirum, imported by R-Pharm since April 2019, is the leader in physical terms here. Rimantadinum, mostly imported by Grand Capital and Mirakl Farm, has the highest dynamics in monetary terms, with a 96 times increase. However, the seasonal trends contributed to the growth the most.
Dynamics of pharmacopoeial and commercial API import to Russia, customs clearance prices (2016 – 2018, January – July 2019), bln RUB