Рус
Рус


Database Update: Veterinary Drug Retail Sales Audit in Russia (June 2020)
Between January and June 2020, the sales of veterinary drugs in the retail market amounted to 10.7 bln RUB (retail prices, VAT included), with the dynamics in monetary terms (rubles) of +1.3%. In physical terms (minimum dosage units), the market volume is 92.2 mln MDUs, with the dynamics of +1.1%.
The dynamics in June were pretty much the same as in May, continuing the stagnation trend, which started mainly due to a drop in the income of the population because of the COVID-19 restrictive measures. According to Rosstat, the first half of 2020, the real disposable income of the population has decreased by 3.7% in the first half of 2020, which forced consumers to use certain saving tools.
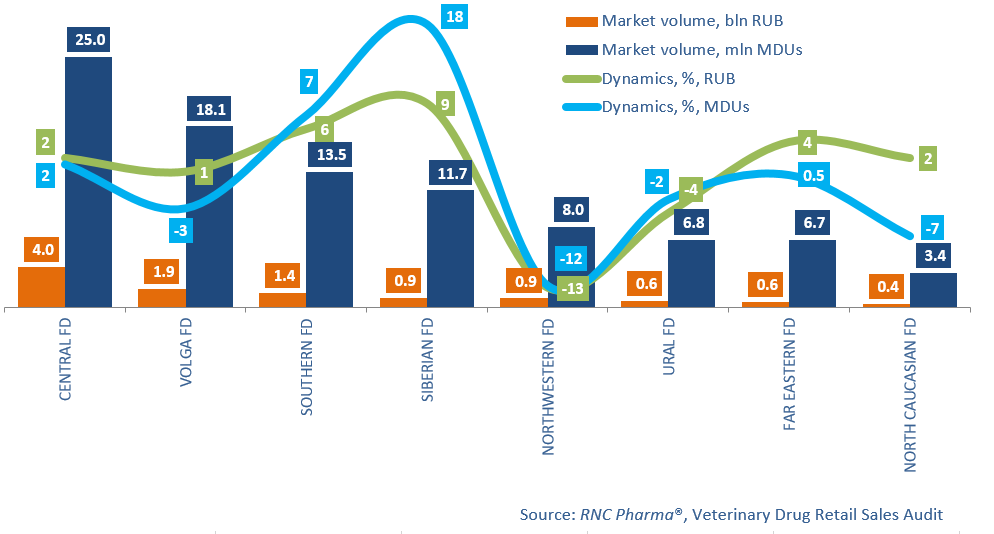
However, the veterinary market has significant regional differences, inkling in terms of the dynamics of development. The largest regional market in terms of absolute volumes, the Central Federal District (FD), demonstrated very moderate growth rates (+2% in monetary and physical terms). The Siberian Federal District had the highest dynamics (9% in monetary and 18% in physical terms). It is interesting that only two months determined the dynamics of the Siberian Federal District (+18.5% in monetary terms in May and +16.1% in June). The reasons are again purely seasonal – this year’s weather characteristics. The Siberian Federal District is followed by the Southern Federal District, with +6% in monetary and +7% in physical terms. Here, May and June also showed impressive dynamics, but still not comparable to the growth in late March.
Despite the trend of economical consumption, the import substitution process in the retail veterinary market is yet to see significant development. Between January and June 2020, the dynamics of the sales of Russian manufacturers kept up with the general market trends. However, the Russian company Agrobioprom has the highest dynamics among the top 20 manufacturing companies (+47% in monetary and + 33% in physical terms). The company’s Pchelodar, Varroadez and Apidez contributed to the dynamics the most. As for foreign companies, Vetoquinol and KRKA have the best dynamics (+43% and 19% in monetary terms, respectively). Vetoquinol’s Ipakitine and Oridermyl and KRKA’s Milprazon, Dehinel, and Marfloxin contributed to the dynamics.
Volume and dynamics of Russian retail market of veterinary drugs in Federal districts (January 2019 – June 2020)