Рус
Рус


Pharmaceutical Drug Production in Russia (May 2020)
Between January and May 2020, Russia manufactured 189.1 bln RUB worth of pharmaceutical drugs (manufacturers’ dispatch prices, VAT included), which is in monetary terms (rubles) 20% higher than in 2019. The dynamics in physical terms (units) are +8.2% (1.88 bln units). If calculated in minimum dosage units (MDU), the dynamics are +11.7% (33.2 bln MDUs).
In comparison with April, May was not as active, although the dynamics were still high. The production volume amounted to 39.2 bln RUB in monetary terms (manufacturers’ dispatch prices, VAT included), with the dynamics of +30.2%. This is the second best dynamics in 2020, coming after February. The dynamics in physical terms are +14.8%, which is also the second best result this year (after April).
In May 2020, the dynamics of the manufacture of OTC drugs nearly reached those of the manufacture of Rx drugs, while they had had several-fold differences before. The dynamics in monetary terms in May 2020 are +14.7% for the manufacture of OTC drugs and 14.9% for that of Rx drugs. However, the dynamics for the period between January and May 2020 are not that close. The dynamics of the manufacture of OTC drugs in physical terms are +3%, while those of the manufacture of Rx drugs are +15.3%.
The companies with the highest dynamics in physical terms are mostly the same both for OTC and Rx drugs. Slavyanskaya Apteka and Research Institute of Medicine and Standardization have the highest dynamics of the manufacture of OTC drugs, and Gippokrat and Mosfarm are the leaders for Rx drugs.
Gippokrat and Mosfarm are followed by Escom (manufacture grown by 4.6 times) and Vertex (by 1.5 times). In the first case, the high dynamics could be explained by the fact that the company actually resumed their activities only in April 2019, and now is only returning to its previous level. Its Sodium Chloride contributed to the dynamics the most, since the manufacture has grown by 3.8 times. The company’s product line has also expanded, from 1 to 8 products. The manufacture of Vertex’s diuretic Lotonel has increased by 6.1 times, but it was Bisoprolol that contributed to the company’s dynamics the most (~4.8 mln units; manufacture grown by 1.9 times).
As for OTC drugs, Firm-M is worth mentioning; the company has increased its manufacture by 121 times in physical terms, while producing only one product — Grippferon. That could be easily explained by the coronavirus pandemic, which encouraged huge demand for antivirals.
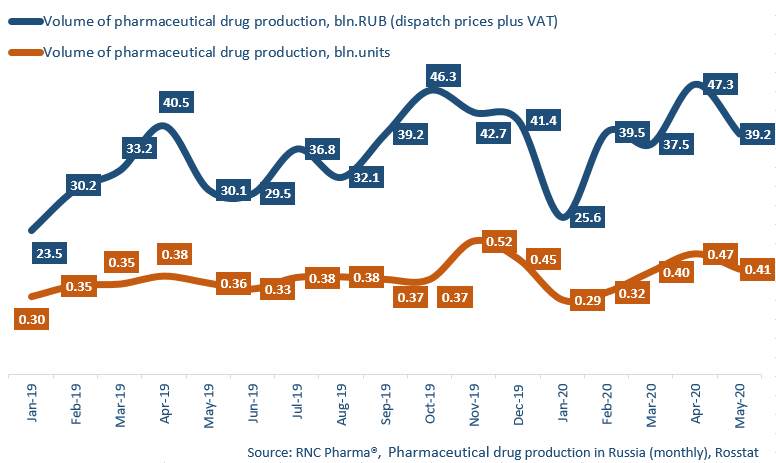
Dynamics of pharmaceutical drug production in Russia, including production of pharmaceuticals of foreign companies on owned or contract plants, in physical (units) and monetary terms (RUB, VAT included) (January 2019 – May 2020)