Рус
Рус


Database Update: Pharmaceutical Drug Production in Russia (May 2019)
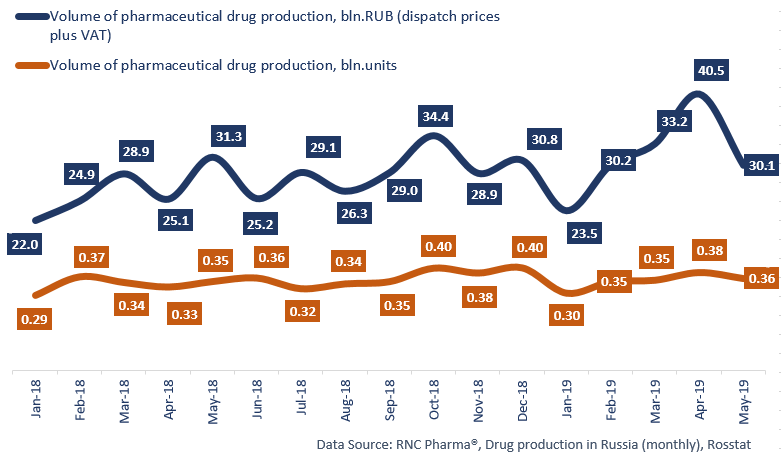
Between January and May 2019, Russia produced 157.5 bln RUB worth of pharmaceutical drugs (manufacturers’ dispatch prices, VAT included), which is in monetary terms (rubles) 19.1% higher than that of the same period in 2018. While the dynamics are positive, they are still significantly lower than those of 2018. These dynamics are due to May’s negative dynamics in monetary terms and low positive in physical terms.
In physical terms, the dynamics for the period are +3.5%, with 1.74 bln units of pharmaceuticals. If calculated in minimum dosage units (MDU), the dynamics are a bit higher, +3.6%. Over the period, Russian pharmaceutical manufacturers dispatched 29.7 bln MDUs.
May 2019 witnessed a typical seasonal drop, while this trend was abandoned in May 2018. The dynamics are -3.8% in monetary terms and +1.9% in physical terms.>/p> The dynamics of OTC drug import in physical terms are -1% for the first 6 months. Among the top 10 companies with the highest dynamics in physical terms, Samaramedprom and Marathon Pharma are the absolute leaders with +56% and +31%, respectively. Pertussinum and Licorice Syrup contributed to the dynamics of Samaramedprom with 6.2 and 3.7 times increases, respectively, and Fluconazole capsules and Rhinorus contributed to the dynamics of Marathon Pharma with 6.9 and 2 times increases.
The dynamics of Rx drug import in physical terms are +11% for the period. Ozon (+59%) and Solopharm (+54%) are noteworthy. Enalapril and Aciclovir contributed to the dynamics of Ozon with 3.6 and 3 times increases. Solutions for injections Meldonium and Calcium Gluconate contributed to the dynamics of Solopharm with 7.9 and 2.3 times increases.
Read more about pharmaceutical drug production in Russia (April 2019) here: http://www.rncph.com/news/29_05_2019
Dynamics of pharmaceutical drug production in Russia, including production of pharmaceuticals of foreign companies on owned or contract plants, in physical (units) and monetary terms (RUB, VAT included) (January 2018 – May 2019)