Рус
Рус


Database Update: Pharmaceutical Drug Import to Russia (March and Q1 2020)
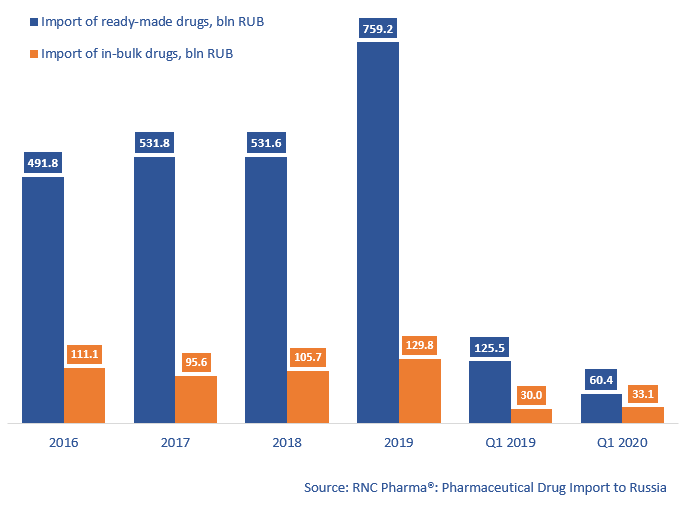
Between January and March 2020, Russia imported 60.4 bln RUB worth of ready-made pharmaceuticals (customs clearance prices, VAT included), which is in monetary terms (rubles) 52% lower than that of the same period in 2019. Russia is still using the volumes imported to Russia last year as part of the preparation for the introduction of the labeling system. However, the dynamics of the in-bulk import are +10%, with the volume of 33.1 bln RUB.
The monthly dynamics of the ready-made drug import in monetary terms were at their worst in January 2020 (-60%), then improved slightly in February with -57%, and those in March (-30%) are somewhat optimistic.
The dynamics of the ready-made drug import in physical terms (units) for the first quarter of 2020 are -64%, with 145.5 mln units. If calculated in minimum dosage units (MDU), the dynamics are -58%. The dynamics of the in-bulk import in physical terms are also negative, -43%. Between January and March 2020, Russia imported 449 mln in-bulk MDUs.
Only three companies in the top 15 importers of ready-made pharmaceuticals in monetary terms have positive dynamics. SG Biotech has the highest dynamics (imports grown by 2.7 times). Their Advate (Octocog Alpha), which was not imported to Russia in Q1 2019, contributed to the dynamics the most, the drug accounts for nearly 65% of the company’s import in monetary terms. Biomarin Pharmaceutical, which did not import to Russia in Q1 2019 either, also has high dynamics; their Naglazyme accounts for nearly 62% of the company’s imports. Johnson & Johnson is also worth mentioning, their imports have doubled. Antitumor Darzalex and antiviral Eviplera contributed to the dynamics the most (imports grown by 26.5 and 4.6 times, respectively).
As for the in-bulk import, only four companies in the top 15 have negative dynamics in monetary terms. Eisai and Roche have the highest dynamics (imports grown by 3.9 and 3 times, respectively). Lenvima and Halaven (production localized at the facilities of Pharmstandard in Ufa) contributed to Eisai’s dynamics, imports increased by 8.7 and 3.1 times. Roche’s high dynamics are the result of the increased import volumes of Kadcyla and Perjeta (by 5.1 and 3.3 times). Both drugs are packaged at the Ortat plant belonging to R-Pharm in the Kostroma Region.
Dynamics of import of pharmaceuticals to Russia (EEU countries excluded), free circulation prices including customs clearance and VAT, RUB (2016 – 2019, Q1 2020)