Рус
Рус


Database Update: Pharmaceutical Drug Production in Russia (December 2019)
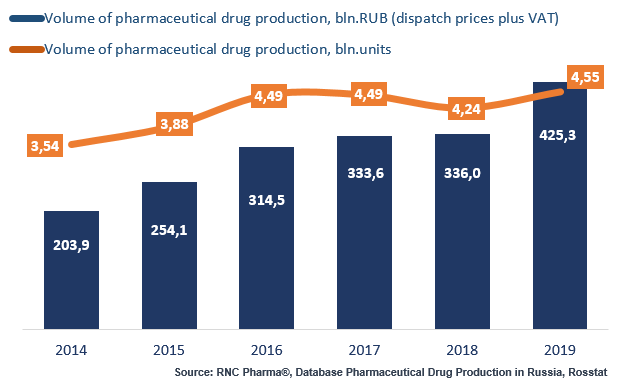
In 2019, Russia manufactured 425.3 bln RUB worth of pharmaceutical drugs (manufacturers’ dispatch prices, VAT included), which is in monetary terms (rubles) 26.6% higher than that in 2018. The results are the highest since the financial crisis between 2015 and 2016. The dynamics in physical terms are +7.4% in units and +6.4% in minimum dosage units (MDU), with 4.5 bln units of ready-made pharmaceuticals, or 75 bln MDUs.
The Russian pharmaceutical industry showed rather atypical dynamics last year, peaking in April 2019 and October 2019, while there were no such bursts of activity in 2018. The pace of development of the pharmaceutical industry between July and December 2019 significantly outstripped that of the first half of the year.
That can be explained by the localization processes of a number of drugs, both the high-cost ones, also purchased within the High-Cost Nosologies program, and those of the middle price segment and mass demand. There was also uncertainty faced by enterprises due to the planned launch of the labelling system starting January 1, 2020. Many were not ready, so they sought to build up inventories. It was already clear in November that the launch date would likely to be postponed, but became certain only in early December 2019, which resulted in pharmaceutical companies actively building up their inventories between September and December.
However, the difference in dynamics of the manufacture of Rx and OTC drugs is still here. The dynamics of the Rx drug production are +20.3% in physical terms (units), while those of the OTC drug production are -0.7%. Last year, companies dispatched more packages with fewer single doses than in 2018.
Escom and Medpolimer have the highest dynamics in the top 20 companies. Escom has increased its production by 3.5 in physical terms, with Trisol and Mannit having the highest dynamics. Medpolimer has increased its production by 2.5 in physical terms, with Ringer’s Solution and Konfumin having the best dynamics.
As for OTC drugs, it is mostly manufacturers of traditional drugs that have high dynamics, including Ivanovo Pharmaceutical Plant with +88% and Samaramedprom with +41%.
Read more about pharmaceutical drug production in Russia (November 2019) here: http://www.rncph.com/news/31_12_2019
Dynamics of pharmaceutical drug production in Russia, including production of pharmaceuticals of foreign companies on owned or contract plants, in physical (units) and monetary terms (RUB, VAT included) (2014 – 2019)