RNC Pharma: Russian Retail Market of Cosmetic Injectables Shows Double-Digit Increase for the Second Year in a Row
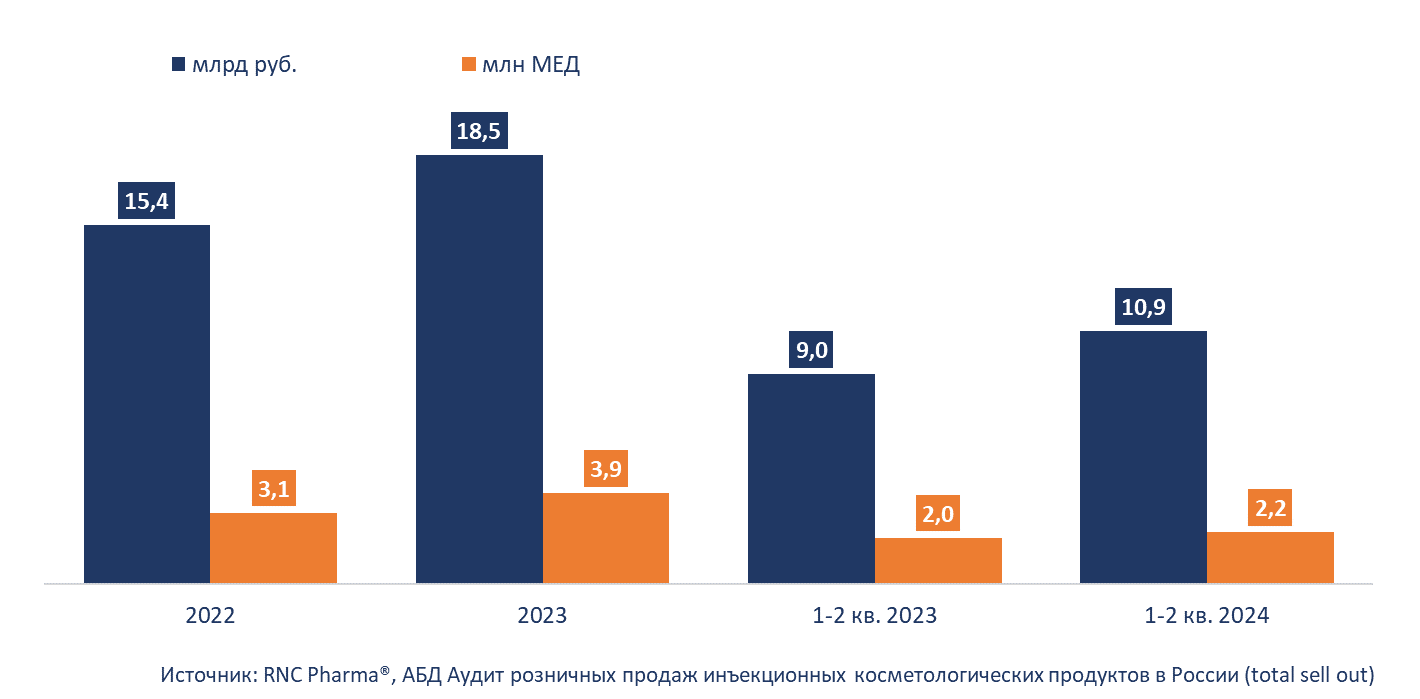
In the first half of 2024, the Russian retail market of beauty fillers and biorevitalization products was 10.9 billion rubles (retail prices, VAT included), up 21% from January–June 2023. In physical terms, it was 2.2 million minimum dosage units (MDU), up 12% from the same period last year. At the same time, the total sales in 2023 were 18.5 billion rubles, or 3.9 million MDUs, up 20% in monetary and up 27% in physical terms.
The main distribution channel for cosmetic injectables are beauty clinics, where the product can both be purchased and administered. In January–June 2024, the clinics accounted for around 94.8% of the sales in monetary terms against 93.4% in 2022. Another important distribution channel is pharmacies, with 4.4%. However, the role of pharmacies keeps falling; back in 2022, they accounted for 6.5%. Finally, less than 1% of cosmetic injectables are distributed online. In physical terms, marketplaces accounted for 7.4% of the sales, mostly through Wildberries, where the Korean biorevitalization product Hyaron is distributed.
Fillers accounted for 62.6% of the sales in monetary terms, and biorevitalization and polylactic acid products accounted for the remaining 37.4%. In physical terms, it was slightly different; due to their high cost, fillers accounted for only 37% of the sales. The average price for a filler in the analyzed period was over 8,000 rubles, three times that of a biorevitalization product, 2,600 rubles. The most expensive products are polylactic acid injections, with over 25,000 rubles.
The sales differed greatly from region to region. For example, Moscow accounted for 35.8% of the sales of fillers and biorevitalization products, which is 3.8 billion rubles, or nearly 745,000 MDUs (33.6%). St. Petersburg ranked second with 9.4% (over 1 billion rubles in sales). Other regions were far behind; even Krasnodar Krai, which ranked third, accounted for only 4.2% of the sales (452.5 million rubles). In Moscow Oblast, the sales were 412.7 million rubles (3.8%). However, the sales in this region grew the fastest among the other top-10 regions; they went up 67% in monetary terms, while the sales in physical terms grew five times against January–June 2023.
Sales dynamics of filers and biorevitalizers on the retail market in Russia

*including manufacturing output of foreign companies at owned and contract plants
 Рус
Рус


