Рус
Рус


Pharmaceutical Drug Export from Russia (June and Q1 – Q2 2020)
Between January and June 2020, Russia exported RUB 23.2 bln worth of ready-made pharmaceutical drugs (customs duties included). This sum does not include Geropharm’s exports of insulins to Venezuela; while the company openly declares its exports, it does not reveal the volumes. The dynamics are +14.7% in monetary terms (rubles), which is significantly higher than those at the end of 2019 (+13%). The volume in physical terms exceeded 0.56 bln units, with the dynamics of +35%.
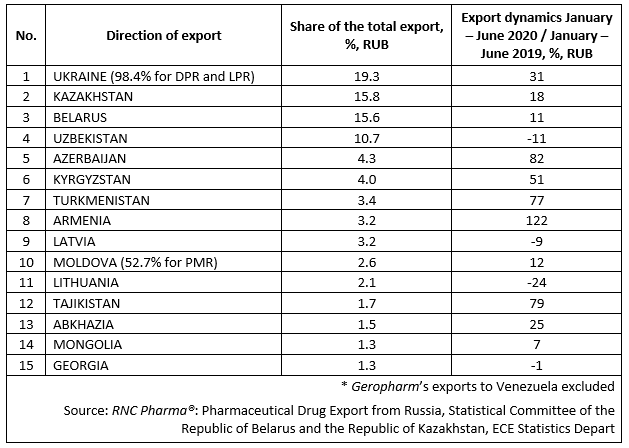
The EEU countries account for nearly 39% of the export of ready-made drugs in monetary terms, amounting to RUB 9 bln (customs duties included). Notably, the dynamics are much higher than those of exports to other countries (+22.5% against +10.3% in monetary terms). All EEU countries are top trade and economic partners of Russia in terms of pharmaceutical drugs. Between January and June 2020, Kazakhstan accounted for the highest volume of export, or 15.8% in monetary terms, which is the second best result. The dynamics of the country are +18% in monetary terms, followed by last year’s leader Belarus with +11%. Armenia and Kyrgyzstan have the best dynamics among the EEU countries, +122% and +51%, respectively.
During the first 6 months of 2020, Russia was exporting pharmaceutical drugs to 72 directions, excluding the EEU countries. Ukraine accounts for the highest volume, and DPR and LPR, in fact, account for more than 98% of the total export to the country. However, Russia exports not only Russian-made drugs to these regions; domestic drugs account for 44% of the export, and nearly 300 manufacturers from 63 countries accounts for the rest. If one does not take into account the need to cross the state border, this is export from neighboring regions of Russia.
Great Britain has the best export dynamics for the period between January and June 2020 (exports have grown by 40 times). Binergia and Syntez accounts for the highest volumes of export to the country, exporting anesthetic Propofol (Binergia) and Ampicillin, Cefazolin, and Amikacin (Syntez).
Exports to the UAE have comparable dynamics, having grown by 33 times. The only exported products were Fentanyl (Moscow Endocrine Plant) and Relatox (Microgen). The companies exported their products without seeking the services of intermediates.
Top 15 directions of the export of pharmaceutical drugs* from Russia, January – June 2020, customs duties included