Рус
Рус


API Import to Russia in 2019
In 2019, Russia imported 132 bln RUB worth of APIs (customs clearance prices, VAT included), which is monetary terms (rubles) 36.3% higher than that in 2018. The import volume in physical terms amounted to 13.2 thousand tons, with the dynamics of +10.2%. The average prices have risen from 8.1 thousand RUB / 1 kg to 10 thousand RUB / 1 kg by the end of 2019.
Monthly dynamics surged abnormally in late summer/early fall. The dynamics of the API import, unlike those of the ready-made drug import, went up earlier, in August and September 2019, against October and November 2019. However, the dynamics of the API import started to slow down in October and decreased significantly by November and December.
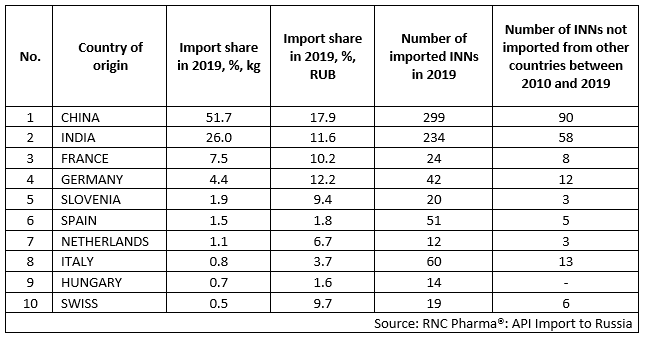
China remains the absolute leader in the volumes of API imports, accounting for 51.7% of the total import in physical terms and 17.9% in monetary terms. The difference can be explained by the policies of certain European manufacturing companies that import crude products to Russia at deliberately exaggerated prices. In terms of product line, China is second to none, having imported 299 INNs in 2019. 90 out of these 299 have no alternatives and, having been imported between 2010 and 2019 from China only.
China is followed by India, with 26% of the import in physical and 11.6% in monetary terms. The country’s product line includes 234 INNs, 57 of which were imported between 2010 and 2019 only from India. In 2010, India accounted for only 8.6% of the total API import in physical terms, which then gradually started to increase, and 9% in monetary terms. However, the Indian importers often depend on Chinese APIs and crude products, which became apparent after the corona virus outbreak, leading to a temporary export ban of a number of ready-made drugs and APIs.
The only country in the top 10 that imports APIs that have alternatives is Hungary (14 INNs in 2019).
Top 10 countries with the highest volume of API import to Russia (EEU countries excluded) in 2019