Рус
Рус


Pharmaceutical Drug Production in Russia (September and Q1 – Q3 2020)
Between January and September 2020, Russian manufacturers produced RUB 356.2 bln worth of ready-made pharmaceutical drugs (manufacturer’s prices, VAT included), which is in monetary terms (rubles) 20.8% higher than in 2019. The dynamics in physical terms (units) are +10.5%, with the manufacture volume of 3.5 bln units. If calculated in minimum dosage units (MDU), the dynamics are +14.2%.
A surge in the manufacture of COVID-related medications followed an increase in COVID-19 cases in September 2020. While the dynamics in monetary terms turned to be even worse than in August (+20.6% against 30.2%), the dynamics in physical terms started to rise again after two months (+18.5%).
Among the top 30 pharmacotherapeutic groups with the highest manufacture volume, azalide antibiotics and vaccines had the best manufacture dynamics in physical terms in September, continuing the August trend. Sulfanilamides (manufacture grown by 3.2 times), hypolipidemic drugs (by 2.3 times), non-opioid analgesics and fluoroquinolones (by 2.2 times) also had high dynamics.
The production of Streptocide had the best dynamics among sulfanilamides, with Lumi (St. Petersburg) and Meligen (Leningrad region) having the largest manufacture volumes. It is interesting that the dynamics went up despite a decrease in the number of manufacturers (from 8 in September 2019 to 6 in September 2020).
As for hypolipidemic drugs, the manufacture of Atorvastatin has increased by 2.5 times in physical terms. In September 2020, the drug was produced by 10 companies at once, with Severnaya Zvezda and Vertex manufacturing the largest volumes.
Paracetamol was the most manufactured drug among non-opioid analgesics. It was produced by 7 companies, including Pharmstandard, Tatchempharmpreparaty and Dalkhimpharm, with Dalkhimpharm having the highest manufacture dynamics, which has increased by more than 48 times. Among fluoroquinolones, the production volume of Levofloxacin was the highest, with the dynamics having grown by 3.8 times. Syntez and Binnopharm have the best manufacture volumes, while Dalkhimpharm has the best dynamics (manufacture grown by 9 times).
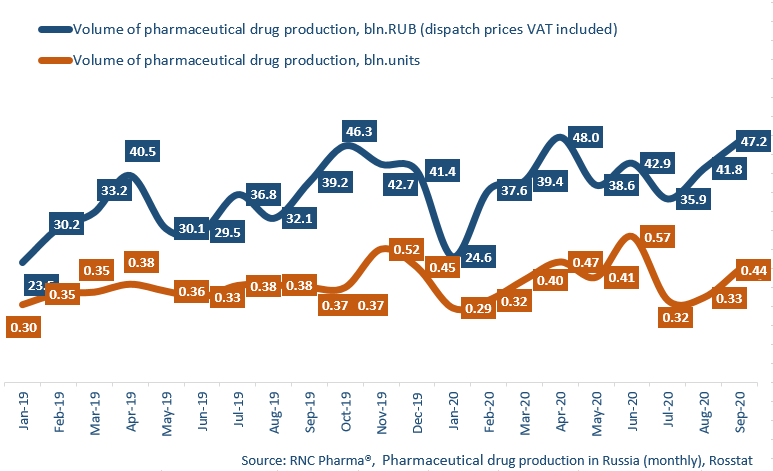
Dynamics of pharmaceutical drug production in Russia, including production of pharmaceuticals of foreign companies on owned or contract plants, in physical (units) and monetary terms (RUB, VAT included) (January 2019 – September 2020)