Рус
Рус


API Import to Russia (July 2022)
In January–July 2022, Russia imported 122 billion rubles’ worth of APIs (customs clearance and VAT included), up 6.1% from January–July 2021. In physical terms, however, the growth rate was as high as 19% (raw materials became cheaper due to ruble revaluation), with 11,300 tons imported.
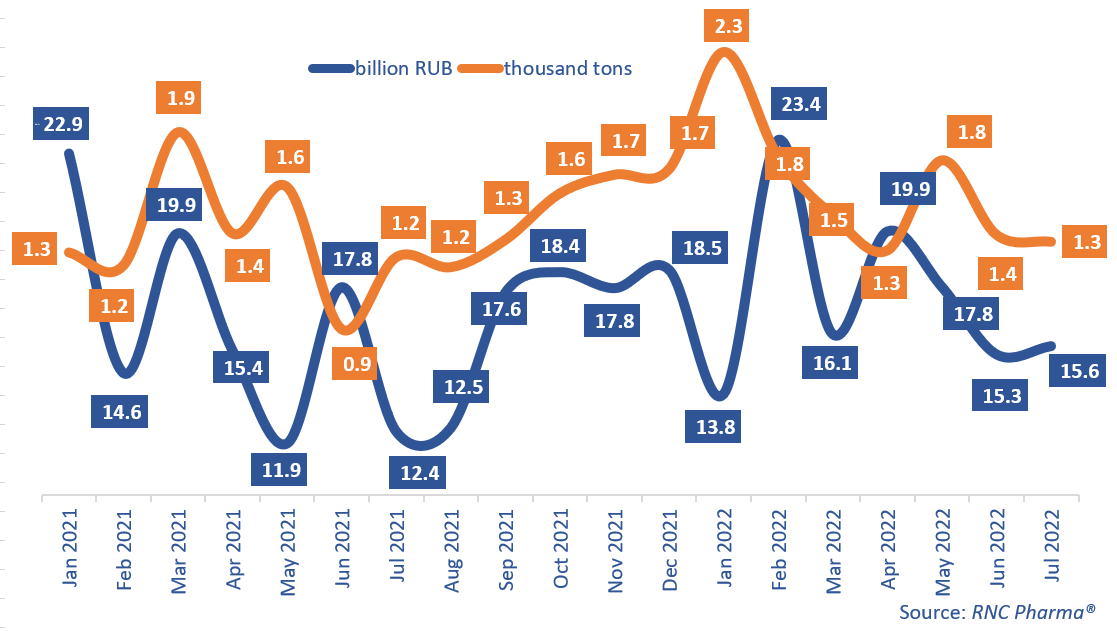
The July results were different from the previous six months: the import was 15.6 billion rubles, up 26% from July 2021. In physical terms, the growth rate was only 6%, with 1,300 tons APIs imported. Compared to June 2022, the import went up 2% in rubles and went down 2.7% in tons.
The import of commercial APIs was several times the volume of pharmacopoeial APIs, which set an important trend in the API import this year. In January–July 2022, the growth rate of the import of commercial APIs was 49% in rubles and 97.6% in tons. At the same time, the share of commercial raw materials in the total import volume remains relatively small, even though it increased: 6.4% in rubles and around 6.7% in tons.
The INNs of imported commercial APIs also grew in number—from 108 in January–July 2021 to 158 in January–July 2022. The number of pharmacopoeial APIs, however, remained practically the same—571 INNs.
Among the top 20 INNs of commercial APIs with the largest import volumes in monetary terms in January–July 2022, purified micronized flavonoid fraction had the best growth rates—its imports grew 19 times against January–July 2021. ActiComp was the main buyer here. Articaine, mainly imported by Kliafarm, came second (imports increased 5.4 times). Articaine was followed by losartan, once again imported by ActiComp (imports grew 4.3 times).
As for pharmacopoeial APIs, osimertinib had the highest growth rates in the top 20—its imports grew 3.5 times against January–July 2021. This API is imported in the interests of AstraZeneca Industries for the production of antitumor Tagrisso in Kaluga Oblast. The import of deproteinized hemoderivative of calf blood increased 2.1 times against January–July 2021; the entire volume was imported in the interests of Takeda for the localization of a foreign drug. Its finished form is produced at a Takeda enterprise in Yaroslavl.
Growth rates of pharmacopoeial and commercial API imports to Russia (EEU countries excluded), free circulation prices including customs clearance and VAT (January 2021–July 2022)