Рус
Рус


Database Update: API Import to Russia (February 2020)
Between January and February 2020, Russia imported 22.6 bln RUB worth of APIs (customs clearance prices, VAT included), which is in monetary terms (rubles) 18.5% higher than that of the same period in 2019. The dynamics in physical terms are +31%, with 2.2 thousand tons of APIs.
The dynamics would not be surprising if it had not been for the unusually high activity of the importers in January. The import volume was not just large, it exceeded that of December in both monetary (+2.5%) and physical terms (+7.8%). The dynamics in January are usually between -20 and -30%. Apparently, it was clear to the Russian importers that the epidemiological situation in China could lead to supply disruptions and sought to have their warehouses restocked.
However, the dynamics in February 2020 were -41% in monetary and -34% in physical terms. Since enterprises in China were closing on a massive scale, the API import volume in February dropped as well. The dynamics were even worse than the segment average, with -44% in monetary and -45% in physical terms. The situation was not critical, though, the total import volume in February 2020 was more or less similar to that in February 2019.
Switzerland became the new leader in the import volume in monetary terms, with the imports grown by 2.1 times. Novartis contributed to the dynamics the most, having increased their import of Vildagliptin by 3 times in both monetary and physical terms. Among the top 15 manufacturing companies, FIS-Fabbrica (Italy) has the highest dynamics, having increased their imports by 160 times in monetary terms. Russia also imported APIs for the manufacture of hypoglycemics, in particular Sitagliptin, imported by Berlin-Chemie and MSD for localized production of the corresponding drugs. Pfizer has the lowest dynamics in the top 15, the import of antigens for the manufacture of pneumococcal vaccines dropped by 49% in monetary and 22% in physical terms. This is also one of the few cases when the selling price of an API has noticeably decreased over the year (-34%).
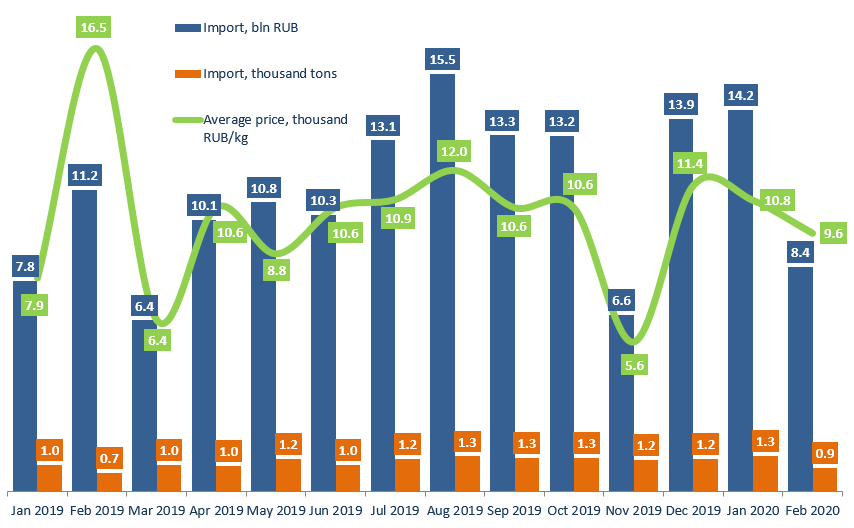
Dynamics of pharmacopoeial and commercial API import to Russia (EEU countries excluded), customs clearance prices (January 2019 – February 2020)