 Рус
Рус


API Import to Russia in 2022
In 2022, Russia imported 191.6 billion rubles’ worth of APIs (customs clearance and VAT included), down 4.2% from 2021 for the first time in 12 years. This is the result of a significant reduction in prices for raw materials with the ruble strengthening, rather than the import falling in physical terms. On the contrary, the import grew by as much as 18.8% in physical terms, with 20,800 tons of pharmacopoeial and commercial APIs imported.
December 2022 seemed to have the average growth rates—the import fell 5% from December 2021, to 17.6 billion rubles. In physical terms, Russia imported 2,100 tons of APIs, up 17% from 2021. Notably, despite being one of the largest of all time, this volume was rather ordinary for 2022—January and August saw even larger import volumes. The number of imported APIs was 717 INNs, up 42. Two of the new APIs were imported in large volumes: cariprazine, imported in the interests of Gedeon Richter RUS for the production of the neuroleptic Reagila, and antiviral nirmatrelvir. The latter was imported in the interests of as many as 3 companies.
China and India accounted for the largest volumes both in monetary and physical terms in 2022. Yet, while Chinese imports grew 8% in monetary and 33% in physical terms, Indian imports went down 13% in monetary and 14% in physical terms. Interestingly, despite the growth rates, both India and China expanded their assortments: up 75 INNs for China and up 40 INNs for India.
The United Kingdom saw the highest growth rates in monetary terms in 2022—its imports increased 30.4 times against 2021. The country’s assortment did not change at all over the year, and the import of dolutegravir, which grew multiple times against 2021, contributed to the growth rates. (Japan used to be the main supplier of dolutegravir.) Poland comes second—its imports grew nearly 11 times against 2021, with soluble genetically engineered human insulin contributing to the growth rates the most.
As for growth rates in physical terms, Swedish imports grew 5 times against 2021. However, the country supplied only one product—metoprolol for AstraZeneca. Imports from Mexico went up 3.8 times against 2021; two main products contributed to the growth rates: naproxen and clavulanic acid. The shortage of the latter led to interruptions in the manufacture of combined antibacterial drugs almost all over the world.
Growth rates of pharmacopoeial and commercial API imports to Russia (EEU countries excluded), free circulation prices including customs clearance and VAT* (2017–2022)
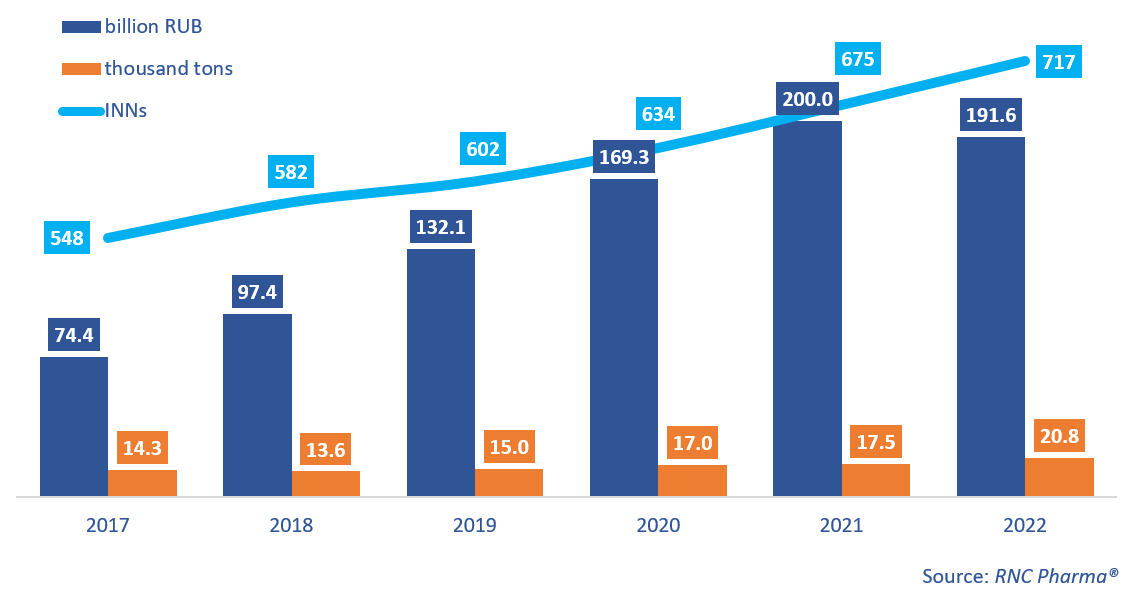
* The current and historical data on the API import into Russia were updated with data on the import of APIs categorized as FEACN Group 28: products of inorganic chemistry; inorganic or organic compounds of precious metals, rare-earth metals, radioactive elements or isotopes.