Рус
Рус


Pharmaceutical Drug Production in Russia (July 2020)
Between January and July 2020, Russia produced 267.1 bln RUB worth of pharmaceutical drugs (manufacturer’s prices, VAT included), which is in monetary terms (rubles) 19.4% higher than in 2019. In physical terms, the production volume is 2.78 bln units, with the dynamics of +13.3%. If calculated in minimum dosage units (MDU), the dynamics are +19%, with the volume of 48.8 bln MDUs.
The results of July 2020 are poorer than those of either June 2020 or July 2019. The manufacturers were no longer focused on stocking up the warehouses before the launch of the labeling system, instead opting for a slower pace, compared to their usual activity at this time of year. The dynamics in July 2020 are -4.4% in monetary and -14.6% in physical terms, compared to July 2019, and -18% and -43%, compared to June 2020.
The dynamics of the manufacture of OTC drugs between January and July 2020 are +7%, with the dynamics being positive only between March and June (-26% in July). The dynamics of the manufacture of Rx drugs are +22% for the period between January and July 2020. They have always been positive in 2020, with the lowest recorded in February (+0.1%) and July (+0.4%).
Among Rx drugs, the manufacture of tonics has the highest dynamics (manufacture grown by 19 times in physical terms), with Limanovit-E by Gippokrat being the most manufactured product in this category. It is difficult to say for sure what the reason behind its success was, since both the COVID-19 epidemic and alcohol-containing medicine abuse could have contributed. Nevertheless, Limanovit-E is the absolute leader among alcohol-containing preparations, even the manufacture of Ethyl Alcohol, which was produced by more than 10 different companies then, is approximately 9% lower than that of Limanovit-E.
Naturally, tonics are followed by antiseptics and disinfecting solutions, which is an obvious consequence of the epidemic. The manufacture of Medical Antiseptic Solution, the largest volume of which was produced by BioFarmKombinat in the Ryazan region, has the highest dynamics (growth by 9.3 times in physical terms).
Chlorhexidine is the most manufactured product in the category, with the dynamics of +150%. It was produced by 12 different companies; the manufacture by Kemerovo Pharmaceutical Factory and Tula Pharmaceutical Factory has grown by 3.4 and 1.5 times, respectively.
As for OTC drugs, antivirals have the best dynamics (+67% in physical terms). The manufacture of Rimantadine (by Usolpharm, Tatkhimfarmpreparaty and other 11 manufacturers) and Arbidol (by Otcpharm) have multifold dynamics. Interestingly, the manufacture of these drugs continued to increase in June and July 2020, despite the more or less stabile situation in the country.
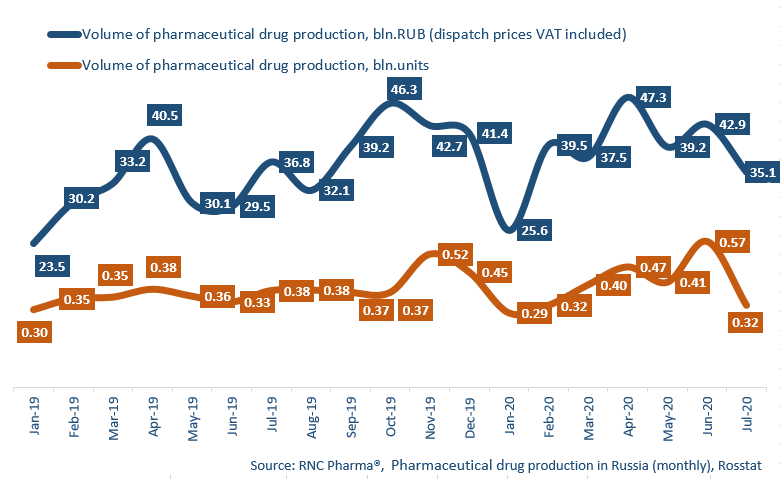
Dynamics of pharmaceutical drug production in Russia, including production of pharmaceuticals of foreign companies on owned or contract plants, in physical (units) and monetary terms (RUB, VAT included) (January 2019 – July 2020)